When the Map Moves: How Updated Rainfall Data Reshapes Floodplain Risk
On paper, the creek hasn’t changed. The banks look the same. The neighborhood feels the same. But then the floodplain map updates, and suddenly a driveway crossing, a planned sidewalk, or a future building pad is sitting in a different risk zone than it was last year.
That’s the reality of modern floodplain work: sometimes what changes isn’t the creek; it’s the data.
In Central Texas, one of the biggest drivers has been NOAA Atlas 14, a major update to rainfall statistics used to define “design storms.” When the 100-year storm rainfall depth changes, runoff estimates change. When runoff changes, the hydraulic model changes. And when the model changes, mapped flood elevations and floodplain boundaries can shift, sometimes in ways that surprise even long-time residents. The City of Austin’s Atlas 14 floodplain effort was launched for exactly this reason, the significant change in design rainfall prompted the need for new study work.
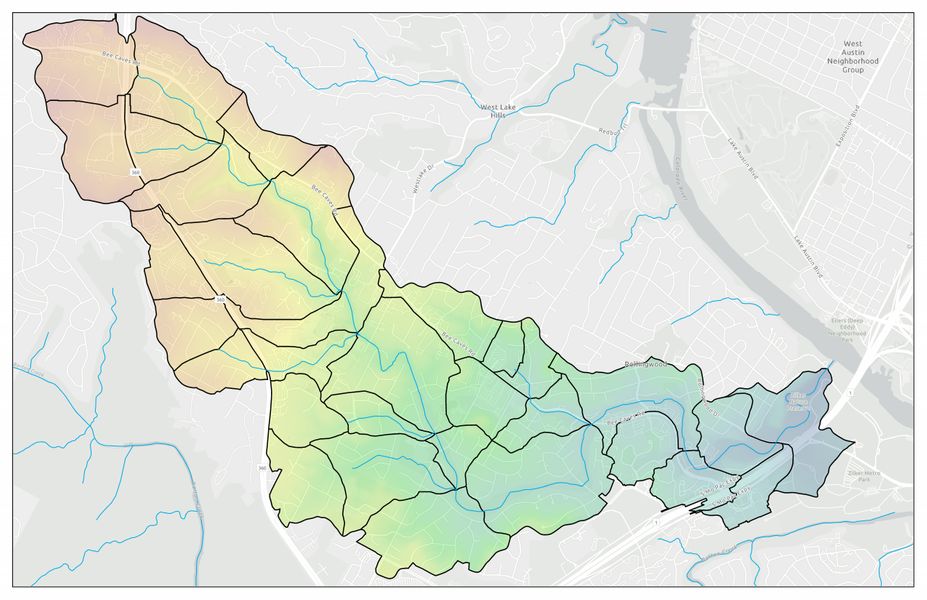
This City-led program focuses on the Urban and West Watersheds south of the Colorado River, a study area that includes Barton Creek, West Bouldin Creek, East Bouldin Creek, Blunn Creek, Eanes Creek, Bee Creek, and tributaries to Lady Bird Lake and Lake Austin. The work involves developing new or updated georeferenced HEC-HMS (hydrology) and HEC-RAS (hydraulics) models using Atlas 14 rainfall, creating 2-D models of the lower quarter of East Bouldin Creek, and evaluating both existing and fully developed land-use conditions.
Within that broader effort, Miller Gray’s work is specifically focused on five watersheds: Bee Creek, Blunn Creek, Eanes Creek, East Bouldin Creek, and Little Bee Creek. It’s not glamorous work—more spreadsheets than spotlights—but it’s the kind of behind-the-scenes engineering that keeps a city moving. Every contour, cross section, and model run is a step toward answering the question communities really care about: Where does the water go, and who’s in its path?
“Floodplain modeling is never just about lines on a map,” said Wade Morrison, PE. “Those lines affect how a city plans crossings, trails, utilities, including future improvements and development. Our job is to make sure floodplain creation, revision, and improvement is performed as accurately and responsibly as possible.”
To keep the modeling grounded in reality, the hydrologic analysis includes simulations of major historical storm events, including October 2013, May 2015, and October 2015, paired with gage analysis where available. That reality check matters. It’s how you build confidence that updated rainfall science is being applied in a way that reflects what actually happens on the ground in these watersheds.
And when the work is done, the results don’t stay locked in a technical report. Updated flood studies support clearer flood-risk communication, better coordination across agencies, and the documentation needed for future FEMA map revisions as the world of rainfall data grows and makes more precise flood mapping possible.
Because in the end, the point isn’t just to redraw the map. It’s to help Austin make smarter choices before the next storm arrives—choices about crossings, trails, neighborhoods, and capital projects that don’t look dramatic on a sunny day, but matter a whole lot when the sky finally opens up.